마이크로바이옴 연구에서 대표적인 프로젝트를 꼽자면 Human Microbiome Project(https://hmpdacc.org/)를 말할 수 있습니다. 또한 데이터를 온라인에서 쉽게 다운로드할 수 있습니다
Human Microbiome Project (HMP) Data Portal
The data portal for data generated from the Human Microbiome Project and Integrative Human Microbiome Project
portal.hmpdacc.org
그러나 데이터가 방대하기 때문에, 직접 분석을 하기에는 컴퓨터 자원이 많이 낭비될 우려가 있습니다. 이를 위해 기존에 제작된 데이터를 찾아봅시다.
🟦 MicrobeDS
GitHub - twbattaglia/MicrobeDS: A repository for large-scale microbiome datasets, formatted for phyloseq
A repository for large-scale microbiome datasets, formatted for phyloseq - twbattaglia/MicrobeDS
github.com
MicrobeDS 패키지는 기존 오픈소스 데이터베이스를 Phyloseq으로 변환한 데이터의 저장소입니다.
- 장점: 대량의 오픈소스 데이터를 phyloseq으로 손쉽게 사용 가능
- 단점: OTU기반이며, 서열 데이터를 얻을 수 없음, taxonomy classification의 품질이 좋지 않음
여기에서 제공하는 데이터는 아래와 같습니다.
Amplicon data
| QIIME 1.9.1, SortMeRNA, Closed-reference OTU-picking at 97% identity
1. Human Microbiome Project (V3-V5, N= 6,000)
- Multiple body sites across hundreds of human subjects
2. Human Microbiome Project (V1-V3, N= 3,285)
- Multiple body sites across hundreds of human subjects
3. MovingPictures (N= 1,967)
- Time series of the human microbiome
4. RISK_CCFA (N= 1,359)
- The treatment-naive microbiome in new-onset Crohn's disease
5. TwinsUK (N=1,024)
- Genetic Determinants of the Gut Microbiome in UK Twins
6. qa10394 (N=1,522)
- Effects of preservation and storage conditions on the fecal microbiome
Metagenome data
| Kraken2
1. Hartwig (N=3,574)
- Hartwig Medical Foundation (HMF)
2. TCGA (N= 17,625)
- The Cancer Genome Atlas (TCGA)
🟦 데이터 사용해 보기
# install.packages("remotes")
# remotes::install_github("twbattaglia/MicrobeDS")
library(MicrobeDS)

# QIIME 1.9.1, SortMeRNA, Closed-reference OTU-picking at 97% identity
data('HMPv35')
data('HMPv13')
data('MovingPictures')

HMPv35
# phyloseq-class experiment-level object
# otu_table()   OTU Table:         [ 10730 taxa and 6000 samples ]
# sample_data() Sample Data:       [ 6000 samples by 33 sample variables ]
# tax_table()   Taxonomy Table:    [ 10730 taxa by 7 taxonomic ranks ]
# phy_tree()    Phylogenetic Tree: [ 10730 tips and 10729 internal nodes ]


HMPv13
# phyloseq-class experiment-level object
# otu_table()   OTU Table:         [ 5830 taxa and 3285 samples ]
# sample_data() Sample Data:       [ 3285 samples by 31 sample variables ]
# tax_table()   Taxonomy Table:    [ 5830 taxa by 7 taxonomic ranks ]
# phy_tree()    Phylogenetic Tree: [ 5830 tips and 5829 internal nodes ]


MovingPictures
# phyloseq-class experiment-level object
# otu_table()   OTU Table:         [ 22765 taxa and 1967 samples ]
# sample_data() Sample Data:       [ 1967 samples by 59 sample variables ]
# tax_table()   Taxonomy Table:    [ 22765 taxa by 7 taxonomic ranks ]
# phy_tree()    Phylogenetic Tree: [ 22765 tips and 22764 internal nodes ]
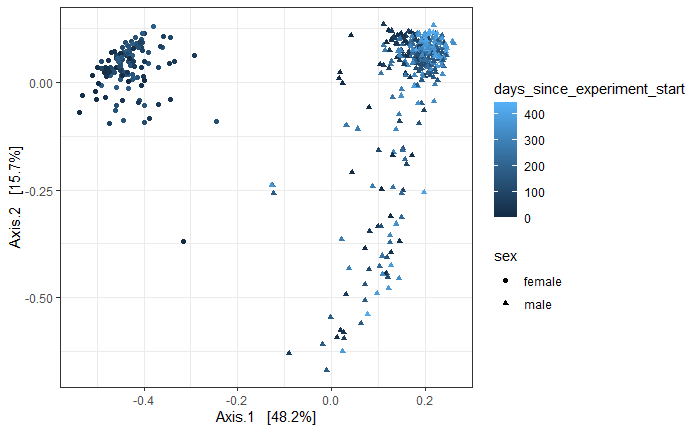
phyloseq이니 손쉽게 시각화가 가능하다.
MP <- MovingPictures
sample_data(MP)$common_sample_site %>% unique
# feces L_palm R_palm Tongue
#   467    499    493    508

# 분석 시간을 줄이기 위해 데이터 축소
MP. <- prune_taxa(taxa_sums(MP)>0.1, MP) # 938 taxa and 1967 samples

# Alpha
plot_richness(MP., x = "common_sample_site" , measures = "Shannon", color = "common_sample_site")+
  geom_boxplot()+
  theme_bw()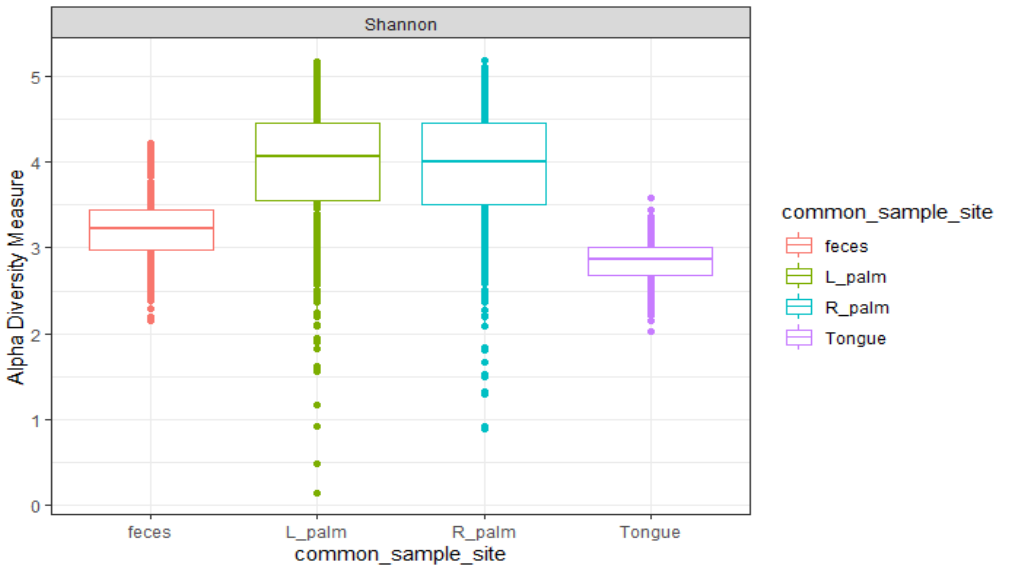
# Beta
MP.gut <- subset_samples(MP., common_sample_site %in% "feces") #  938 taxa and 467 samples
MP.gut.ord <- ordinate(MP.gut, "PCoA", "bray")
p1 = plot_ordination(MP.gut, MP.gut.ord,
                     type="samples", color="days_since_experiment_start",
                     shape = "sex")+
  theme_bw()

print(p1)