
작성: 2024.01.31/ 수정: 2024.07.29
"Go TH, Kang DR. Basic Concepts of a Mendelian Randomization Approach. Cardiovasc Prev Pharmacother. 2020;2(1):24-30." 를 기반으로 작성되었음.
Mendelian randomization (MR) study
MR연구 배경
의학 연구에서 가장 주요 목표는 특정 질병, 결과에 대한 위험 요소를 판별하는 것이다. 이때 노출(exposure)과 결과(outcome)사이에 인과관계를 확립하기 위하여 무작위 대조실험(RCT)를 수행한다. 그러나 모든 연구에 RCT가 수행될 수 없으며, 많은 의학 연구가 관찰에 그치게 된다.
그러나 관찰 연구는 노출과 결과 사이의 혼란변수(confounding variable) 를 배제하기 어려우져, 이는 잘못된 인과관계 추론이 발생할 가능성이 존재한다.
MR연구는 1986년 Katan이 제안한 것으로 콜레스케롤 수치와 암의 위험성의 연관성을 조사하기 위하여 도구변수(instrumental variable, IV)를 활용하였다.
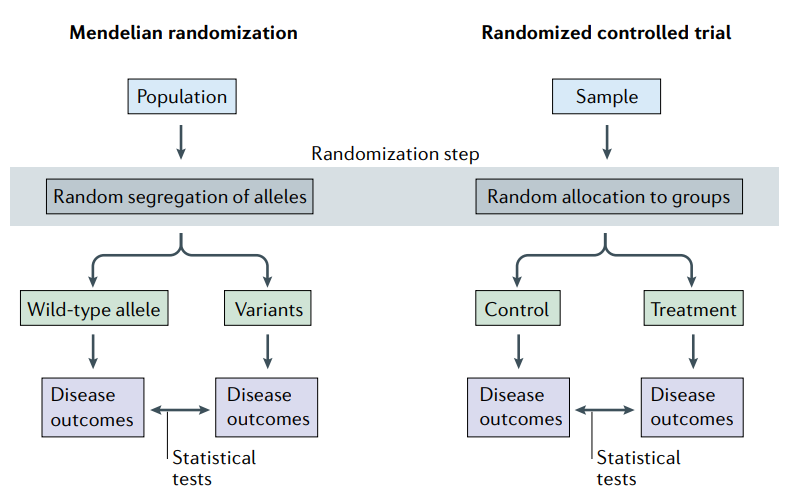
RCT와 달리 MR 연구는 대립 유전자의 무작위 할당으로 인한 randomization을 활용한다.
MR연구 단계
| 1 | 인과 추론을 위한 가설 설정 |
| 2 | GWAS 또는 문헌에서 지원 정보를 사용하여 유전적 도구 변수(IV) 선택 |
| 3 | 선택된 도구 변수(IV)에 대한 MR 가정 확인 |
| 4 | MR 분석 수행 |
| 5 | 결과 해석 및 논의 |
MR연구의 3가지 가정
1) The genetic variant is strongly associated with the exposure
2) The genetic variant is independent of the outcome, given the exposure and all confounders (measured and unmeasured) of the exposure-outcome association,
3) The genetic variant is independent of factors (measured and unmeasured) that confound the exposure-outcome relationship.
*용어*
MR연구에서 genetic variant = SNP = IV(도구변수)
MR의학 연구에서 Risk factor = exposure
MR분석 도구
예제 데이터를 통해 MR연구를 수행해보자. MR단계에 따라 5단계로 나누어 진다.
1. 온라인 플랫폼 MRbase
- MRbase: https://app.mrbase.org/
- 영상 tutorial: https://www.youtube.com/watch?v=E5uc5kJlu2c
- tutorial: https://si.biostat.washington.edu/sites/default/files/modules/Session13_MendelianRandomization.pdf
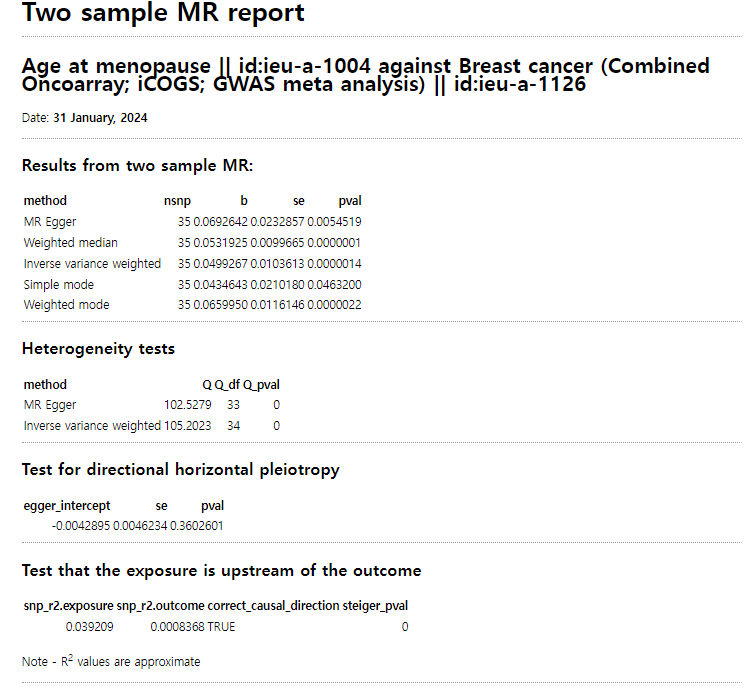
tutorial링크에서는 나이에 따른 유방암에 대한 MR분석을 소개하고 있다(exposure=Age, outcome=breast cancer ).
온라인으로 분석후, 아래와 같은 보고서도 다운받을 수 있다.
2. R에서 진행
위와 동일한 데이터로 R에서 분석을 수행해 보자. 분석 도구는 TwoSampleMR R package를 사용한다.
- TwoSampleMR tutorial: https://mrcieu.github.io/TwoSampleMR/articles/perform_mr.html
## INSTALL
install.packages("devtools")
library(devtools)
install_github("MRCIEU/TwoSampleMR")

library(TwoSampleMR)
library(ggplot2)

## 사용 가능한 GWAS 데이터 불러오기
ao <- available_outcomes()

# exposures과 outcome데이터 살펴보기
ao[ao$id %in% "ieu-a-1004", ] # Age at menopause
ao[ao$id %in% "ieu-a-1126", ] # Breast cancer

# Age에 영향을 주는 SNP 추출
age_exp_dat <- extract_instruments(outcomes = 'ieu-a-1004')
head(age_exp_dat)


# Age에 영향을 주는 SNP중 Breast cancer에도 영향을 주는 SNP 추출
out_dat <- extract_outcome_data(
    snps = age_exp_dat$SNP,
    outcomes = 'ieu-a-1126'
)

# Harmonise 분석
dat <- harmonise_data(age_exp_dat, out_dat)

# MR 분석
res <- mr(dat)
- TwoSampleMR의 기본 함수를 사용하여 Scatter plot, Forest plot, Leave-one-out plot, Funnel plot 을 그려보자.
## Scatter plot ##
p1 <- mr_scatter_plot(res, dat)
p1[[1]]
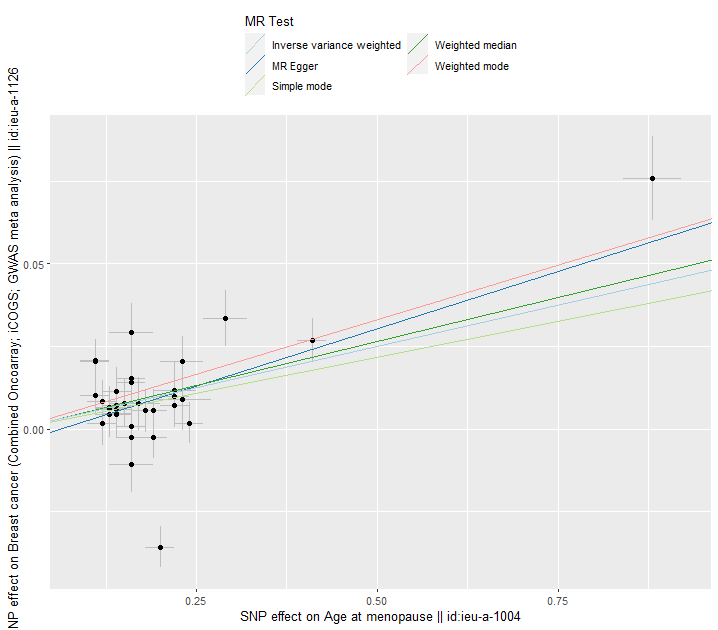
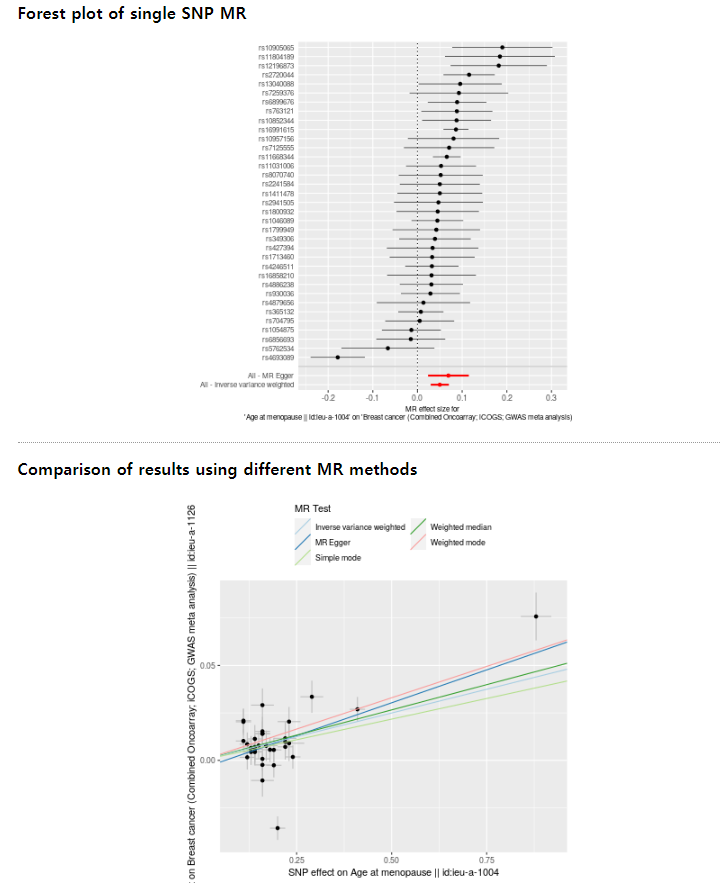
여러 MR 추정 선이 그려진 scatter plot으로 각 SNP에 대한노출 및 결과 연관성을 보여준다. 각 점 주변의 오차 막대는 SNP와 노출, SNP와 결과 사이의 추정 연관성에 대한 표준 오차를 보여준다.
아니면 특정 분석 방법만 추출해서 그려보자.
res <- mr(dat, method_list = c("mr_egger_regression", "mr_ivw"))
#> Analysing 'ieu-a-2' on 'ieu-a-7'
p11 <- mr_scatter_plot(res, dat)
p11[[1]]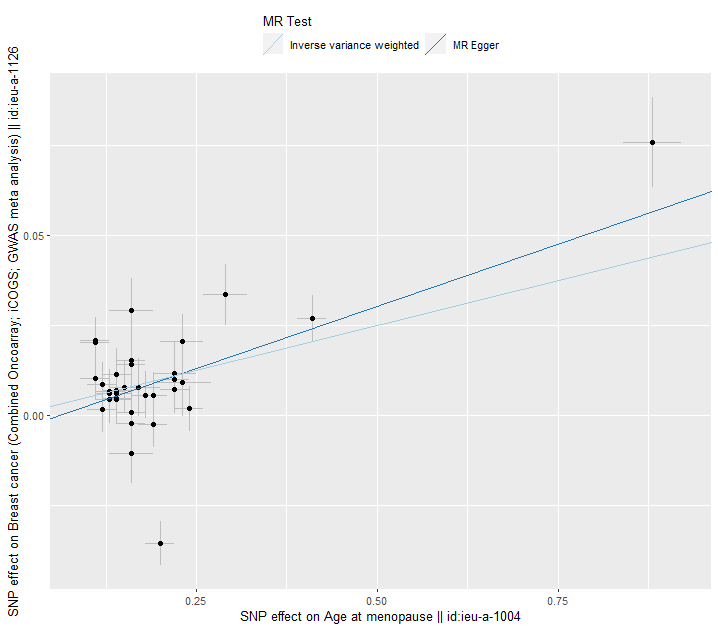
## Forest plot ##
res_single <- mr_singlesnp(dat)
p2 <- mr_forest_plot(res_single)
p2[[1]]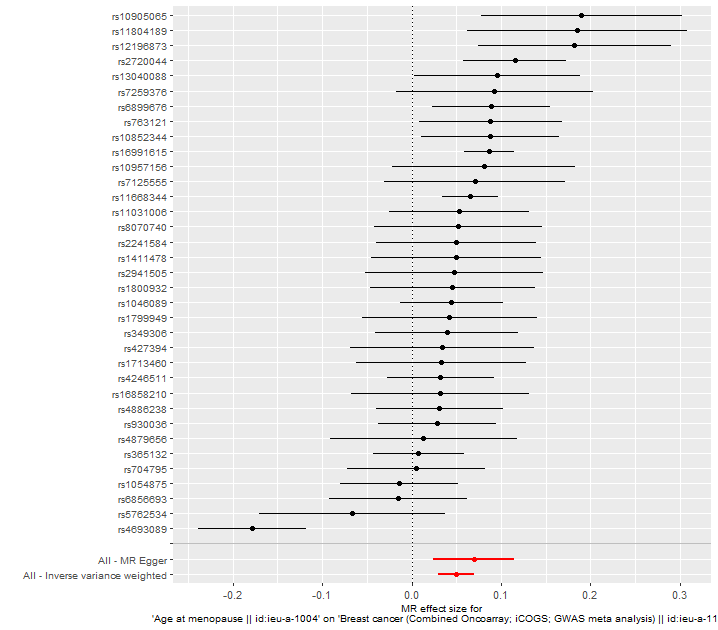
Forest plot은 개별 SNP별로 추정된 인과효과를 비교하고, 전반적인 인과효과를 같이 보여준다.
이때 각 도구변수의 신뢰구간과 효과크기를 한 눈에 볼 수 있으며, 전체적인 효과의 일관성 평가에 사용된다.
res_single <- mr_singlesnp(dat, all_method = c("mr_ivw", "mr_two_sample_ml"))
p2 <- mr_forest_plot(res_single)
p2[[1]]

## Leave-one-out plot ##
res_loo <- mr_leaveoneout(dat)
p3 <- mr_leaveoneout_plot(res_loo)
p3[[1]]
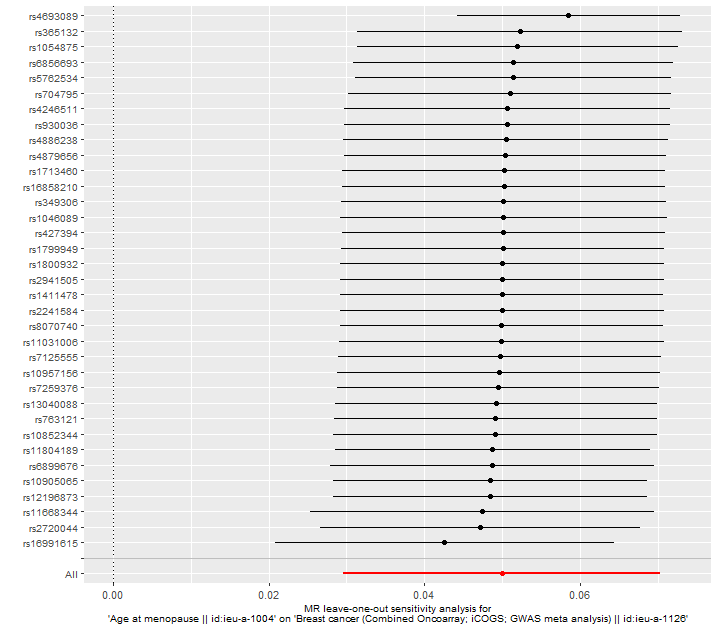
Leave-one-out 분석은 각 도구 변수를 하나씩 제외하고 MR 분석을 반복하여, 특정 도구 변수가 전체 결과에 미치는 영향을 평가하는 방법이다. 이 분석을 통해 특정 도구 변수가 분석 결과를 과도하게 좌우하는지(즉, 편향을 유발하는지) 확인할 수 있다.
## Funnel plot ##
res_single <- mr_singlesnp(dat)
p4 <- mr_funnel_plot(res_single)
p4[[1]]
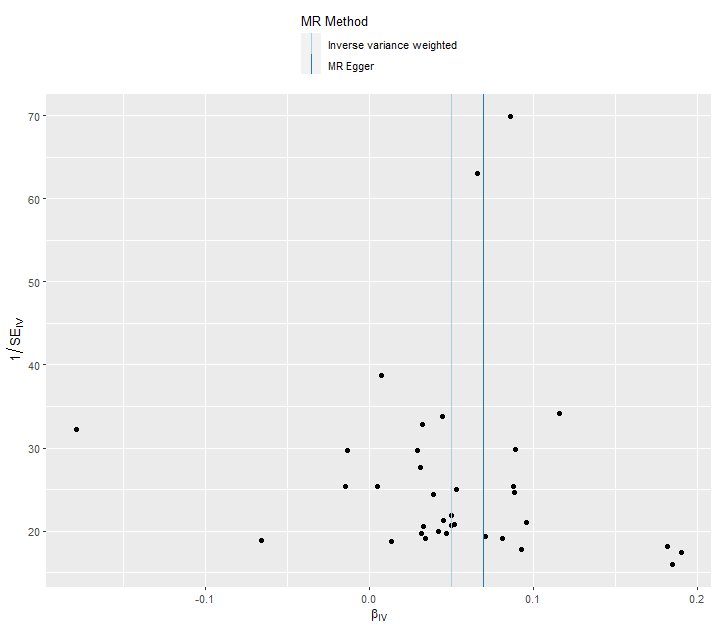
Funnel plot은 도구 변수의 변동성을 평가하는 데 사용되며, 개별 SNP의 효과 추정값과 그에 대한 불확실성(표준 오차)을 나타낸다.
이상적인 Funnel plot은 대칭적이며, 이는 무작위 분포되어있고 편향이 없음을 의미한다.
효과 추정값이 큰 도구변수는 plot의 하단에 넓게 퍼진다. 표준오차가 작은 도구변수는 plot의 상단에 위치하며 중앙에 모여 있다.
참고
- Go TH, Kang DR. Basic Concepts of a Mendelian Randomization Approach. Cardiovasc Prev Pharmacother. 2020;2(1):24-30.
- R분석: https://andrewslabucsf.github.io/MR-tutorial/scripts/intro.html
- 참고강의: https://www.statslab.cam.ac.uk/~qz280/talk/epfl-2021/
- 실제 분석 스크립트1: https://github.com/MRCIEU/Health-and-Wellbeing-MR/blob/master/Two-sample%20MR%20Base%20script.R#L41
Xu, W., Zhang, L., & Song, X. (2024). Exploring the link between gut microbiota and alopecia areata: a two-sample Mendelian randomization analysis. International journal of dermatology, 10.1111/ijd.17032. Advance online publication. https://doi.org/10.1111/ijd.17032
위 논문은 MR 분석을 수행하여 Gut microbiome 이 AA에 영향을 미친다는 결과를 내놓았다. 사용된 exposure데이터는 Mibiogene의 Genus 데이터(총 32GB)이며 132개의 Genus에 대한 결과를 나타내고 있다. outcome데이터는 Finngene(현재 홈페이지 접속 불가능)의 finn-b-L12_ALOPECANDRO데이터이다.
작성: 2024.01.31/ 수정: 2024.07.29
"Go TH, Kang DR. Basic Concepts of a Mendelian Randomization Approach. Cardiovasc Prev Pharmacother. 2020;2(1):24-30." 를 기반으로 작성되었음.
Mendelian randomization (MR) study
MR연구 배경
의학 연구에서 가장 주요 목표는 특정 질병, 결과에 대한 위험 요소를 판별하는 것이다. 이때 노출(exposure)과 결과(outcome)사이에 인과관계를 확립하기 위하여 무작위 대조실험(RCT)를 수행한다. 그러나 모든 연구에 RCT가 수행될 수 없으며, 많은 의학 연구가 관찰에 그치게 된다.
그러나 관찰 연구는 노출과 결과 사이의 혼란변수(confounding variable) 를 배제하기 어려우져, 이는 잘못된 인과관계 추론이 발생할 가능성이 존재한다.
MR연구는 1986년 Katan이 제안한 것으로 콜레스케롤 수치와 암의 위험성의 연관성을 조사하기 위하여 도구변수(instrumental variable, IV)를 활용하였다.
RCT와 달리 MR 연구는 대립 유전자의 무작위 할당으로 인한 randomization을 활용한다.
MR연구 단계
| 1 | 인과 추론을 위한 가설 설정 |
| 2 | GWAS 또는 문헌에서 지원 정보를 사용하여 유전적 도구 변수(IV) 선택 |
| 3 | 선택된 도구 변수(IV)에 대한 MR 가정 확인 |
| 4 | MR 분석 수행 |
| 5 | 결과 해석 및 논의 |
MR연구의 3가지 가정
1) The genetic variant is strongly associated with the exposure
2) The genetic variant is independent of the outcome, given the exposure and all confounders (measured and unmeasured) of the exposure-outcome association,
3) The genetic variant is independent of factors (measured and unmeasured) that confound the exposure-outcome relationship.
*용어*
MR연구에서 genetic variant = SNP = IV(도구변수)
MR의학 연구에서 Risk factor = exposure
MR분석 도구
예제 데이터를 통해 MR연구를 수행해보자. MR단계에 따라 5단계로 나누어 진다.
1. 온라인 플랫폼 MRbase
- MRbase: https://app.mrbase.org/
- 영상 tutorial: https://www.youtube.com/watch?v=E5uc5kJlu2c
- tutorial: https://si.biostat.washington.edu/sites/default/files/modules/Session13_MendelianRandomization.pdf
tutorial링크에서는 나이에 따른 유방암에 대한 MR분석을 소개하고 있다(exposure=Age, outcome=breast cancer ).
온라인으로 분석후, 아래와 같은 보고서도 다운받을 수 있다.
2. R에서 진행
위와 동일한 데이터로 R에서 분석을 수행해 보자. 분석 도구는 TwoSampleMR R package를 사용한다.
- TwoSampleMR tutorial: https://mrcieu.github.io/TwoSampleMR/articles/perform_mr.html
## INSTALL
install.packages("devtools")
library(devtools)
install_github("MRCIEU/TwoSampleMR")

library(TwoSampleMR)
library(ggplot2)

## 사용 가능한 GWAS 데이터 불러오기
ao <- available_outcomes()

# exposures과 outcome데이터 살펴보기
ao[ao$id %in% "ieu-a-1004", ] # Age at menopause
ao[ao$id %in% "ieu-a-1126", ] # Breast cancer

# Age에 영향을 주는 SNP 추출
age_exp_dat <- extract_instruments(outcomes = 'ieu-a-1004')
head(age_exp_dat)


# Age에 영향을 주는 SNP중 Breast cancer에도 영향을 주는 SNP 추출
out_dat <- extract_outcome_data(
    snps = age_exp_dat$SNP,
    outcomes = 'ieu-a-1126'
)

# Harmonise 분석
dat <- harmonise_data(age_exp_dat, out_dat)

# MR 분석
res <- mr(dat)
- TwoSampleMR의 기본 함수를 사용하여 Scatter plot, Forest plot, Leave-one-out plot, Funnel plot 을 그려보자.
## Scatter plot ##
p1 <- mr_scatter_plot(res, dat)
p1[[1]]
여러 MR 추정 선이 그려진 scatter plot으로 각 SNP에 대한노출 및 결과 연관성을 보여준다. 각 점 주변의 오차 막대는 SNP와 노출, SNP와 결과 사이의 추정 연관성에 대한 표준 오차를 보여준다.
아니면 특정 분석 방법만 추출해서 그려보자.
res <- mr(dat, method_list = c("mr_egger_regression", "mr_ivw"))
#> Analysing 'ieu-a-2' on 'ieu-a-7'
p11 <- mr_scatter_plot(res, dat)
p11[[1]]
## Forest plot ##
res_single <- mr_singlesnp(dat)
p2 <- mr_forest_plot(res_single)
p2[[1]]
Forest plot은 개별 SNP별로 추정된 인과효과를 비교하고, 전반적인 인과효과를 같이 보여준다.
이때 각 도구변수의 신뢰구간과 효과크기를 한 눈에 볼 수 있으며, 전체적인 효과의 일관성 평가에 사용된다.
res_single <- mr_singlesnp(dat, all_method = c("mr_ivw", "mr_two_sample_ml"))
p2 <- mr_forest_plot(res_single)
p2[[1]]
## Leave-one-out plot ##
res_loo <- mr_leaveoneout(dat)
p3 <- mr_leaveoneout_plot(res_loo)
p3[[1]]
Leave-one-out 분석은 각 도구 변수를 하나씩 제외하고 MR 분석을 반복하여, 특정 도구 변수가 전체 결과에 미치는 영향을 평가하는 방법이다. 이 분석을 통해 특정 도구 변수가 분석 결과를 과도하게 좌우하는지(즉, 편향을 유발하는지) 확인할 수 있다.
## Funnel plot ##
res_single <- mr_singlesnp(dat)
p4 <- mr_funnel_plot(res_single)
p4[[1]]
Funnel plot은 도구 변수의 변동성을 평가하는 데 사용되며, 개별 SNP의 효과 추정값과 그에 대한 불확실성(표준 오차)을 나타낸다.
이상적인 Funnel plot은 대칭적이며, 이는 무작위 분포되어있고 편향이 없음을 의미한다.
효과 추정값이 큰 도구변수는 plot의 하단에 넓게 퍼진다. 표준오차가 작은 도구변수는 plot의 상단에 위치하며 중앙에 모여 있다.
참고
- Go TH, Kang DR. Basic Concepts of a Mendelian Randomization Approach. Cardiovasc Prev Pharmacother. 2020;2(1):24-30.
- R분석: https://andrewslabucsf.github.io/MR-tutorial/scripts/intro.html
- 참고강의: https://www.statslab.cam.ac.uk/~qz280/talk/epfl-2021/
- 실제 분석 스크립트1: https://github.com/MRCIEU/Health-and-Wellbeing-MR/blob/master/Two-sample%20MR%20Base%20script.R#L41
Xu, W., Zhang, L., & Song, X. (2024). Exploring the link between gut microbiota and alopecia areata: a two-sample Mendelian randomization analysis. International journal of dermatology, 10.1111/ijd.17032. Advance online publication. https://doi.org/10.1111/ijd.17032
위 논문은 MR 분석을 수행하여 Gut microbiome 이 AA에 영향을 미친다는 결과를 내놓았다. 사용된 exposure데이터는 Mibiogene의 Genus 데이터(총 32GB)이며 132개의 Genus에 대한 결과를 나타내고 있다. outcome데이터는 Finngene(현재 홈페이지 접속 불가능)의 finn-b-L12_ALOPECANDRO데이터이다.